Home / Blog / Laptop battery
How to Generate and Analyze a Windows Battery Health Report

Lithium-based laptop power storage degrades over time due to high operating temperatures, high state-of-charge exposure, and cumulative charge-discharge cycling. For system administrators, helpdesk engineers, and power users, reliance on basic operating system taskbar icons provides insufficient detail regarding true cell degradation. Windows includes a native command-line utility, powercfg, capable of directly interfacing with hardware abstraction layers and Advanced Configuration and Power Interface (ACPI) firmware controllers. Learning to generate powercfg battery report outputs allows technical professionals to extract structural telemetry, evaluate internal resistance trends, and execute structured laptop battery calibration steps to preserve hardware reliability.
⚡ Key Takeaways
- Core Concept: Windows
powercfgextracts deep ACPI register logs into structured HTML reports detailing design vs. actual capacity. - Key Requirement / Metric: Tracking the delta between Design Capacity and Full Charge Capacity yields an accurate mathematical wear ratio.
- Action Step: Execute administrative terminal commands, analyze capacity drop curves, and recalibrate internal fuel gauges when telemetry drifts.
- Common Pitfall: Replacing healthy batteries prematurely due to temporary gas gauge drift rather than true chemical cell death.
ACPI Firmware Architecture and Windows Power Subsystem Interactions
Modern laptops rely on a complex physical architecture to report battery telemetry to the operating system kernel. Embedded inside every battery pack is a Smart Battery System (SBS) compliant gas gauge Integrated Circuit (IC)—manufactured by vendors like Texas Instruments, Renesas, or Maxim. This fuel gauge IC measures current flow via an internal shunt resistor, tracks cell group voltages, and monitors embedded negative temperature coefficient (NTC) thermistors.
The fuel gauge communicates with the laptop's Embedded Controller (EC) across an internal System Management Bus (SMBus) or Inter-Integrated Circuit (I2C) physical interface. The EC then exposes these hardware registers to the Windows kernel through the ACPI BIOS tables. Specifically, the Windows kernel power manager uses ACPI.sys to query control methods such as _BIF (Battery Information) and _BST (Battery Status), or the updated _BIX (Battery Information Extended) interface.
+-----------------------+     SMBus / I2C     +-----------------------+
| Smart Battery Pack    |-------------------->| Embedded Controller   |
| (Gas Gauge IC & NTC)  |                     | (EC Firmware)         |
+-----------------------+                     +-----------------------+
                                                          |
                                                    ACPI Tables
                                                    (_BIF / _BIX / _BST)
                                                          v
+-----------------------+     Kernel I/O      +-----------------------+
| Windows Power Manager |<--------------------| ACPI.sys & battc.sys  |
| (powercfg.exe Engine) |                     | Device Drivers        |
+-----------------------+---------------------+-----------------------+
When you run diagnostic utilities, the system executes kernel-level I/O control calls (IOCTLs) against the battery stack driver (battc.sys and compbatt.sys). This mechanism bypasses basic application abstraction layers to retrieve exact milliamp-hour (mAh) or milliwatt-hour (mWh) figures directly from hardware memory, providing absolute precision for system auditing.
Command-Line Execution: How to Generate Powercfg Battery Report Logs
Generating diagnostic reports requires elevated administrative privileges to issue raw hardware IOCTL requests to the battery controller. Standard shell instances will be blocked by User Account Control (UAC) security policies.
Executing Elevated Command Prompt and PowerShell Commands
To initiate the diagnostic query, launch an administrative Command Prompt or PowerShell shell and enter the primary diagnostic switch. The basic syntax generates a complete HTML file in the current working directory:
powercfg /batteryreportTo direct the output to a specific administrative audit repository or customized file path, append the /output flag alongside a fully qualified path enclosed in quotation marks:
powercfg /batteryreport /output "C:\Diagnostics\BatteryReport_2026.html"For extensive enterprise fleet troubleshooting—especially when investigating battery drain issues during low-power modern standby states—you can combine battery reporting with energy logging and duration modifiers:
# Generate standard battery report
powercfg /batteryreport /duration 14 /output "C:\Logs\battery_14day.html"

# Generate complementary 60-second system energy efficiency trace
powercfg /energy /output "C:\Logs\energy_audit.html" /duration 60
System administrators managing hundreds of remote endpoints can automate this process across network domains using a basic PowerShell administrative block:
$ReportPath = "C:\Temp\BatteryReport_$env:COMPUTERNAME.html"
Start-Process powercfg.exe -ArgumentList "/batteryreport /output `"$ReportPath`"" -NoNewWindow -Wait
if (Test-Path $ReportPath) {
    Write-Host "[SUCCESS] Battery report generated at $ReportPath" -ForegroundColor Green
} else {
    Write-Error "[ERROR] Failed to output battery diagnostic report."
}
Deep-Dive Analysis of Output Sections and Capacity Metrics
Once you open the output HTML document, Windows structures the diagnostic data into several logical tables. Understanding the specific meaning of each data node allows for accurate decision-making during maintenance cycles.
1. Installed Batteries
This introductory section presents hardware identification attributes retrieved directly from the battery EEPROM:
- NAME & SERIAL NUMBER: Hardcoded factory strings. Mismatched or generic serial strings (such as "00000") often indicate third-party aftermarket replacement packs with non-compliant fuel gauges.
- CHEMISTRY: Displays chemical construction, typically LION (Lithium-Ion) or LiP (Lithium-Polymer).
- DESIGN CAPACITY: Represents nominal factory energy storage capability expressed in mWh when the cell group was manufactured.
- FULL CHARGE CAPACITY: The absolute maximum energy storage achievable at the present moment under full charge conditions.
2. Recent Usage and Battery Drain Curves
This chronological log tracks system power state changes over the preceding 72 hours. It logs transitions between AC Power and Battery Power, detailing exact capacity loss in both percentage terms and absolute mWh values. Rapid drops over short time windows (e.g., losing 20% capacity in 5 minutes under minimal load) signal internal cell imbalance or rising internal DC resistance (ESR).
3. Battery Capacity History
This long-term trend table tracks how the battery's full charge capacity has evolved compared to its design baseline over months of operation. Analyzing this block helps identify whether capacity loss is following a steady linear progression or experiencing severe exponential drops due to thermal degradation.
Calculating Battery Capacity Loss and Evaluating Wear Levels
Raw milliwatt-hour numbers must be converted into standardized health percentages to determine whether a power cell is safe for operational deployment or ready for decommission. Technical teams use mathematical formulas to calculate battery capacity loss and evaluate hardware reliability.
Mathematical Degradation and Health Formulas
To establish the current health status of a battery, apply the capacity health formula:
Health Ratio (%) = ( Full Charge Capacity / Design Capacity ) * 100Conversely, to evaluate your active windows battery wear level, subtract the overall health percentage from 100:
Wear Level (%) = 100 - Health Ratio (%)
OR
Wear Level (%) = [ ( Design Capacity - Full Charge Capacity ) / Design Capacity ] * 100
Consider a workstation with a factory Design Capacity of 72,000 mWh that currently reports a Full Charge Capacity of 46,800 mWh:
Health Ratio = ( 46,800 mWh / 72,000 mWh ) * 100 = 65%
Wear Level = 100% - 65% = 35% Capacity Loss| Diagnostic Parameter | Healthy Baseline (0-15% Wear) | Moderate Degradation (16-30% Wear) | Critical Wear (>35% Loss) | Operational Impact & Risk |
|---|---|---|---|---|
| Full Charge vs Design | Delta < 15% mWh | Delta between 15% and 30% | Delta > 35% mWh | Proportionate reduction in total wireless unplugged runtime. |
| Cycle Count Metric | < 250 Equivalent Cycles | 250 to 500 Cycles | > 600 Cycles | Increased cell internal resistance; elevated operating temperature. |
| Voltage Stability | Linear Discharge Curve | Slight non-linear dips | Sudden drop spikes (>15%) | System powers off abruptly without executing clean shutdown scripts. |
| Standby Drain (Modern) | < 1.0% / hour in Sleep | 1.0% - 3.0% / hour | > 4.0% / hour | Depletes battery reserves fully overnight during low-power states. |
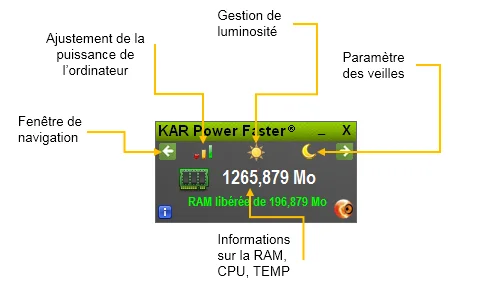
When hardware reaches a critical wear level exceeding 35%, software optimizations alone cannot restore lost chemical capacity. However, combining diagnostic monitoring with intelligent background throttle controls via specialized applications like KAR Power Faster can mitigate excess thermal generation and limit aggressive drain states. Additionally, implementing policies to increase laptop battery life helps preserve remaining healthy capacity on aging systems.
Pro Tip: A battery displaying a wear level above 40% combined with a rapidly swelling casing poses physical risks. Inspect chassis seams and trackpads for physical lifting, which indicates hazardous lithium cell off-gassing. Replace such packs immediately.
Practical Laptop Battery Calibration Steps for Restoring Telemetry Accuracy
Over months of partial charging (e.g., plugging in at 30% and unplugging at 80%), the Coulomb counter within the internal gas gauge IC experiences register drift. The chip loses track of the true chemical upper and lower voltage limits, causing Windows to report an artificially high wear level. Executing structured laptop battery calibration steps re-establishes true register baselines without physically altering the cells.
Comprehensive Manual Recalibration Sequence
- Top Charge Saturation Phase: Connect the original OEM AC power adapter. Charge the device uninterrupted until the system reaches 100% capacity. Allow the machine to remain on AC power for at least 2 additional hours. This constant-voltage (CV) charging phase balances individual cell series strings and resets the high-voltage gauge register.
- Disable OS Sleep Triggers: Open Windows Control Panel or Settings, navigate to Power & Battery settings, and temporarily set all Sleep, Hibernate, and Display Off timeouts to "Never".
- Configure Critical Power Thresholds: Open
powercfg.cpl, select your active Power Plan, click Change advanced power settings, expand Battery, and set Critical battery action on battery to Hibernate or Shut down. Change the Critical battery level to its lowest permissible value (typically 2% to 3%). - Linear Continuous Discharge: Disconnect the AC power supply. Allow the system to discharge steadily under a light-to-moderate workload until it forces an automatic hibernation/shutdown. Do not interrupt this drain phase.
- Chemical Resting Period: Leave the machine unpowered and disconnected from the charger for 3 to 5 hours. This resting phase allows the internal cell chemistry to stabilize its Open Circuit Voltage (OCV), allowing the gas gauge IC to accurately map its zero-state register.
- Complete Full Recharge: Reconnect the AC adapter while keeping the machine powered off or in idle state. Allow the battery to charge continuously back to 100% in one unbroken pass.
After completing these steps, run the command to generate powercfg battery report telemetry once again. In cases of gauge drift, you will frequently observe an increase in reported Full Charge Capacity, bringing your calculated wear metrics back into alignment with actual hardware performance. For broader fleet optimization, review our guide on how to extend battery life on Windows and read our technical article on how to Extend Laptop Battery Lifespan: A Technical Guide for Windows.
Enterprise Troubleshooting, Automation, and Edge Cases
In managed corporate environments, executing diagnostic commands occasionally yields unexpected errors due to Group Policy restrictions, driver incompatibilities, or security software interventions.
1. Access Denied / Output Path Writing Failures
If executing powercfg /batteryreport outputs an Unable to perform operation. An unexpected error has occurred (0x5) message, the command shell lacks administrative elevation, or the target path is locked by Windows Defender Application Control (WDAC). Always default to saving reports in write-accessible directories such as C:\Temp or user profile folders, and ensure PowerShell sessions are launched with Run as Administrator permissions.
2. Missing Battery Node / ACPI Driver Corruption
If the generated HTML file displays blank entries under Design Capacity or reports no installed batteries on a functional laptop, the ACPI control method battery driver may be corrupted in the Windows driver store. To resolve this issue, execute the following device management steps via administrative PowerShell:
# Disable and re-enable Microsoft ACPI-Compliant Control Method Battery
Get-PnpDevice -Class 'Battery' | Where-Object {$_.FriendlyName -match 'ACPI-Compliant'} | Disable-PnpDevice -Confirm:$false
Start-Sleep -Seconds 3
Get-PnpDevice -Class 'Battery' | Where-Object {$_.FriendlyName -match 'ACPI-Compliant'} | Enable-PnpDevice -Confirm:$false
If driver re-enumeration fails to restore telemetry, verify that system firmware (UEFI/BIOS) is fully updated. Laptop OEMs regularly issue microcode updates that address SBS communication timing issues on SMBus controllers.
3. Modern Standby (S0 Low Power Idle) Sleep Depletion
Modern Windows laptops often swap traditional S3 sleep states for S0 Low Power Idle (Modern Standby). In this state, background network activity, cloud syncing, and Windows Update tasks remain active while the lid is closed. If your powercfg report indicates heavy drain while the device is sleeping, execute a dedicated sleep study to isolate culprit hardware drivers or applications:
powercfg /sleepstudy /output "C:\Diagnostics\sleep_analysis.html"The resulting report pinpoints specific software threads or PCIe root ports that prevent the System on Chip (SoC) from entering deep C-states (such as C8, C9, or C10), helping technical teams remediate high off-state power drain.
For additional assistance regarding advanced firmware diagnostics and power settings adjustments, consult our Battery FAQ resource hub.
Actionable Diagnostic Summary Checklist
Follow this standardized administrative workflow whenever evaluating laptop battery performance:
- Launch an administrative Command Prompt or PowerShell shell using elevated credentials.
- Run
powercfg /batteryreport /output "C:\Path\Report.html"to generate current system telemetry. - Inspect the Installed Batteries table to compare Design Capacity against Full Charge Capacity.
- Apply the capacity health formula to calculate battery capacity loss and evaluate your current windows battery wear level.
- If capacity figures appear inconsistent with actual runtime, complete the full 6-step laptop battery calibration steps process.
- Execute
powercfg /sleepstudyif unexpected battery drain occurs during system sleep modes. - Schedule battery replacements for hardware demonstrating wear levels exceeding 35% or exhibiting physical structural swelling.
Frequently Asked Questions
Why does my full charge capacity differ from design capacity on a brand new laptop?
Manufacturing tolerances in lithium-ion chemistry cause slight variations in initial capacity. Additionally, battery management firmware may under-report maximum capacity by 2-5% out of the box to prevent overcharging stress on fresh cells.
How frequently should an IT department execute powercfg battery reports across a laptop fleet?
Automated quarterly scripts are recommended for general maintenance. However, individual reports should be generated immediately whenever a user reports unexpected system shutdowns, battery swelling symptoms, or active runtime dropping below two hours.
Can powercfg battery reports fix physical battery degradation?
No, powercfg is purely a diagnostic logging tool that queries ACPI and SBS firmware registers. It cannot reverse chemical wear, though performing laptop battery calibration steps can restore reporting accuracy when internal fuel gauges drift.
What level of windows battery wear level indicates an immediate need for cell replacement?
A wear level exceeding 30% to 35% capacity loss indicates significant degradation. At this point, cell impedance increases, causing potential voltage sags under heavy load that trigger hardware protective cut-offs.
KAR Power Faster
Maximize portable battery longevity and prevent premature battery degradation under Windows.
Explore KAR Power Faster →